How do you convey the key drivers of property performance to Investment Committee (IC)?
The first major hurdle you need to clear as a real estate private equity analyst is being able to construct a reliable and accurate LBO model. That isn’t where your job ends. You also need to be able to test the assumptions built in to your private equity real estate model and gauge the impact those changes have on performance.
Sensitivity Analysis
In a sensitivity analysis, you choose different variables to manipulate and record the output. Some private equity real estate analysis software will perform this function once you have defined the variables you want to test. If you are building your own model, however, you’ll have to build a sensitivity analysis manually.
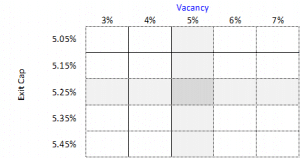
Once your model is complete and you confident in the results, select two variables that you want to manipulate. Build a simple table in excel to record results, like this:

In the table above, the established base case for the model is an assumption of 5% vacancy and an exit cap of 5.25%. This allows your base returns to appear in the center of the chart. You can compare almost any variable in the project, so long as your private equity real estate model is built to allow for a simple adjustment of the assumption, and the rest of the model re-calculates automatically.
You also have choices when it comes to which output to show in the table. A typical output would be the LP IRR or the LP Multiple, but you could also use LP net cash or Exit value of the asset. Choose outputs that are meaningful to the decision making process of your IC.
Another choice is how big of a change for each other variables. In the example above we used a 1% change in average vacancy rate, but only a 10 bp change in the cap rate. This is because of the relative impacts that each of those variables have on the model.
Step By Step
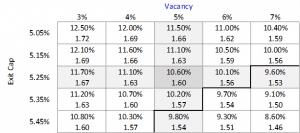
As you are building your sensitivity analysis, be careful to work sequentially, either by columns or rows. That will help you not get confused on where you are with your output table. In our example, change the vacancy rate to 4%, then record the output; then change the vacancy to 3%. This would be working by rows. Once you’ve filled in the vacancy changes against a continuous exit cap, change the exit cap (either up or down) and repeat the vacancy changes for that row. Your output table should look something like this:

Two things to point out about the output table: First, there are two measures of output for each cell- LP IRR and LP Multiple. You can do this to accommodate two different measures of performance without having to build two tables. Second, there are dark lines on the lower right-hand third of the table. These lines indicate a hypothetical IRR floor of 10% for the LP’s. You can use all kinds of clever formatting of your tables to help communicate information visually to your readers.
The End Goal
The whole point of your private equity real estate analysis is to communicate your findings to IC or other decision makers. A sensitivity analysis is helpful because it helps managers understand the key risk factors in the deal, and how much those factors influence performance. This is critical in arriving at a risk-adjusted return for the project. If you can communicate the sensitivity as well as you can build the LBO model, you will quickly become a favorite analyst in the company!
