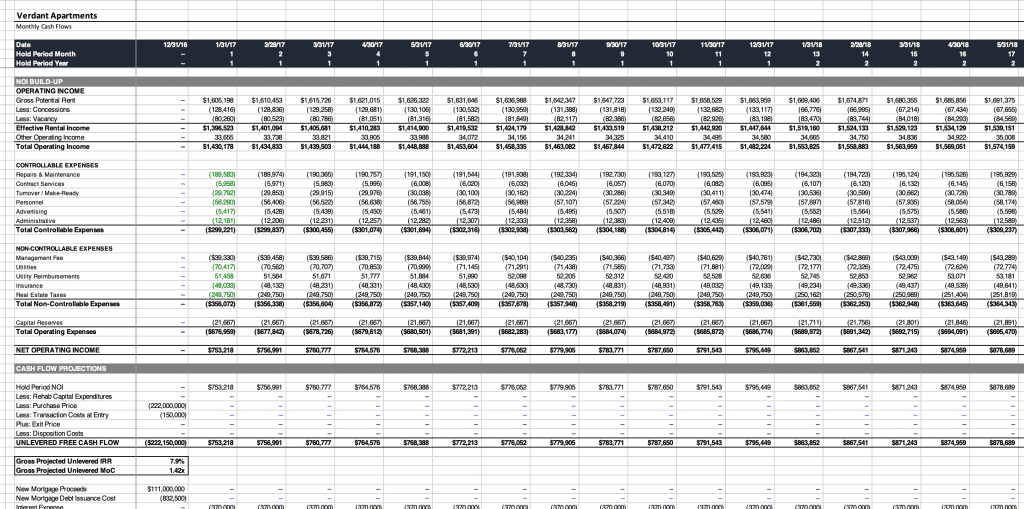
Solution
This challenge is over! Nevertheless, you should be able to knock this out pretty easily if you are interviewing for real estate private equity jobs. You may download the solution here. The solution walkthrough begins in this post. Continue reading for the prompt and judgment criteria — this post is important before starting the case.
Introduction
Welcome to the first Leveraged Breakdowns real estate private equity investment case study challenge! We will review your case if submitted before midnight on April 30, 2019. All submissions must be made in the relevant thread for this challenge on the case study help forum. We will actively monitor this discussion in case you have any questions and post all relevant updates in the thread.
You may share your file with any uploading service of your choice. One accurate solution exists, but your Excel could look different than any other participant’s Excel. We will judge you on your use of simple formulas, style and arrangement, trustworthiness, and correctness. Disclaimer: All submissions will be subject to public review, but any personal information will be removed. We will publicly review your model for the benefit of the entire Leveraged Breakdowns community.
We Offer Free Professional Review
We will professionally review cases submitted to the relevant thread in our Case Study Help forum before the deadline of April 30th at 11:59pm.
Various Methodologies Are Valid
Your Excel model will have its own unique look and feel. Strive to develop your own style while appreciating others’ best practices. Thus, don’t worry too much about the exact design and implementation of your solution. Just focus on calculating the proper answer. Remember, numerous Excel formulas can achieve the same goal and are equally valid. For example, SUMIFS and Index-Match can both lookup growth rates from an Inputs tab. Ultimately, your focus should remain on the investment thesis and cash flow story.
One Solution Is Correct
In real life, talented investors may calculate different return profiles for the exact same investment. Unlike real life, this particular case challenge gives you every assumption. Thus, this case challenge has very little room for interpretation. Although style and form may vary, one solution exists for this case. Below, we detail our judgment criteria for this case study challenge.
Our Judgment Criteria
Criteria #1: Simple Formulas
Real estate private equity investments professionals spend more time reading LBO models than they spend actually modeling LBOs. Thus, your real estate LBO model needs to be an easy read. Please, avoid long formulas that follow winding spaghetti paths. Your formulas should generally serve one purpose. For instance, don’t both lookup AND apply a growth rate in the same formula. If you ever wish to change the functionality of your growth rate, disentangling the infrastructure becomes a massive headache.
Here is an example of a bad Excel formula:
=IF(E3=”red”,100,IF(E3=”blue”,200,IF(E3=”green”,300,IF(E3=”orange”,400,500))))
via ExcelJet
Criteria #2 Style and Arrangement
Real Estate Private Equity LBO Models exist to convey information. Models with bad style and arrangement are hard to read. Thus, poorly styled models are bad because they do not quickly convey information. Your font color codes should be consistent with Investment Banker-style formatting (i.e., blue hardcodes, black formulas, and green external links). If you don’t believe the importance of good formatting, imagine which of the two models below you’d rather be stuck auditing at 2AM on a Sunday night.
Bad Style Example

Good Style Example

Criteria #3: Accuracy and Trust
How can a colleague quickly tell whether your model is accurate? You can make it easy for your colleagues to trust your models by building robust checks. Checks make sure that A + B = C when A + B should equal C. Checks are quick to build while modeling because they represent obvious truths. Wouldn’t you prefer to know if your revenue and expenses don’t match the summed profit? Checks can save your life from stupid mistakes.
Building checks will increase trust and save your colleagues time. Thus, checks are a win-win in any Excel model. Every model needs robust checks. Any REPE LBO model without obvious, robust built-in checks is an immediate failure.
Criteria #4: Correctness
Of course, your REPE LBO model needs to be correct. If you do not calculate the proper return for this real estate private equity case study challenge, your model is broken. Mentioned above, this challenge has one correct answer.
Relevant Educational Materials
If you need to grasp the basics of real estate LBO modeling, check out our Real Estate Private Equity Starter Kit. You should budget three or four hours for this course.
Our other course, Breaking Down Real Estate Private Equity, dives quite deep into real estate private equity investments. This course teaches every skill necessary to underwrite a multifamily investment from scratch. You will need several weeks to complete this course.
The Case Prompt
Here is the case prompt. Imagine an apartment building is for sale. If your real estate private equity fund targets a gross levered IRR of 11.0%, what Gross Asset Value would it assign to this building? Assume the following information.
Unlevered Assumptions
- Monthly cash flow timeline
- Hold period of 10 years
- 350 total units
- Average Effective Rent of $3,500 per unit per month
- Average total other income of $50 per unit per month
- Occupancy through the hold period of 95.0%
- Total operating expenses of $1,250 per unit per month
- You reasonably predict recurring capital maintenance expenditures of $400 per unit per year
- Property management fee, charged on total income, is 2.5%
- All income grows at 3.0% every year
- All expenses grow at 2.5% every year
- The T0 market cap is 4.5%, expanding at 5bps per year. The inflated exit cap is what you apply to your NTM exit NOI for GAV.
Levered Assumptions
- The property is unencumbered, offered free and clear
- Your fund targets leverage at 50.0%
- The debt is floating-rate at L+200bps
- The interest only period lasts for 60 months
- The amortization term is 360 months
Useful External Resources
You can find the LIBOR curve on Chatham Financial’s website. Chatham provides industry standard LIBOR curves.
You can learn more about debt amortization at Excel Easy, YouTube, etc. Modeling principal amortization is a well-documented subject.
